Last week, I introduced localStorage and sessionStorage. I also suggested a few options to get notifications when such storage gets updated.
Today, I will cover how we can visualize and debug storage data. In Google Chrome, open the dev tools (right-click on the webpage, then “inspect” or press Ctrl + Shift + I).
Once the dev tools panel shows up, click on the “Application” tab:
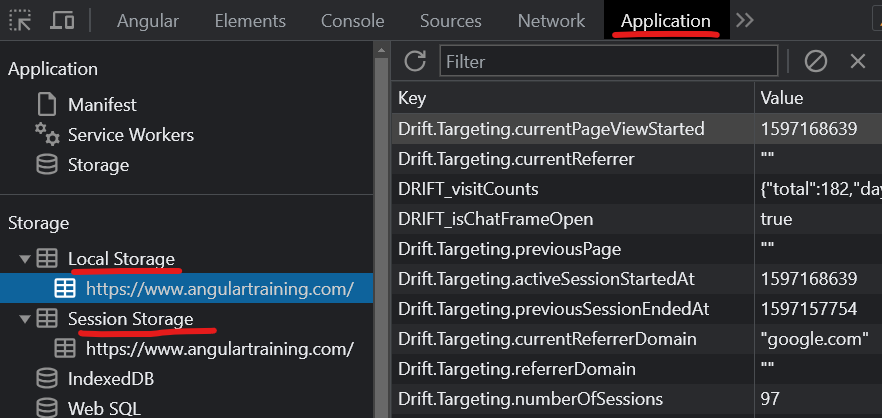
You can select Local Storage or Session Storage on the left-hand side. This shows you the contents of those storages on the right-hand side in key-value pairs. Storage is by domain, so using those tools on a different website would show you different data.
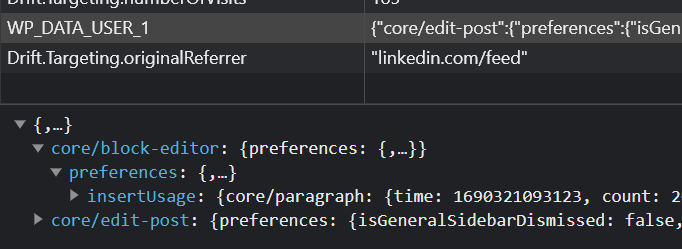
If an object is stored as a JSON string, you can click on the key-value row, and Chrome shows a collapsible version of that Javascript object at the bottom of the screen, making it easy to explore complex objects:
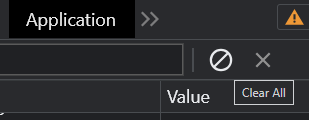
There are two buttons in the top right corner of that same panel. One allows you to clear the entire storage for the current domain, while the second one (the X) clears the currently selected key-value pair:
You can edit a key or value by double-clicking on the corresponding cell in the right panel’s table. This makes testing different values, resetting a cache, or debugging specific scenarios easy.