Angular Component Testing with Cypress

Great news! Thanks to all your contributions, I’m happy to organize another coffee-fueled 2-hour workshop in January, which will be about testing Angular components with Cypress!

The date is January 18th, 2024, at 9 am US/Pacific (time zone converter here).

Like last time, the workshop will be on Zoom, and we’ll have a few hands-on exercises. A recording will be shared with all attendees after the workshop. You can register here and contribute here to keep me caffeinated.

If you have ideas for future workshops, please let me know. I do have a few, but I’m always open to suggestions.

Make types from JSON samples

First, a quick announcement: I’m running a donation-based online Angular Signals Workshop on December 14th and January 18th. If you’re interested, feel free to show your interest here, and remember that you don’t have to pay anything if you don’t want to or can’t.

Earlier this year, I shared how to generate type definitions for Typescript using json2ts, but that website has disappeared. A suggested superior alternative is Quicktype, which can also create DTOs and has several config options.

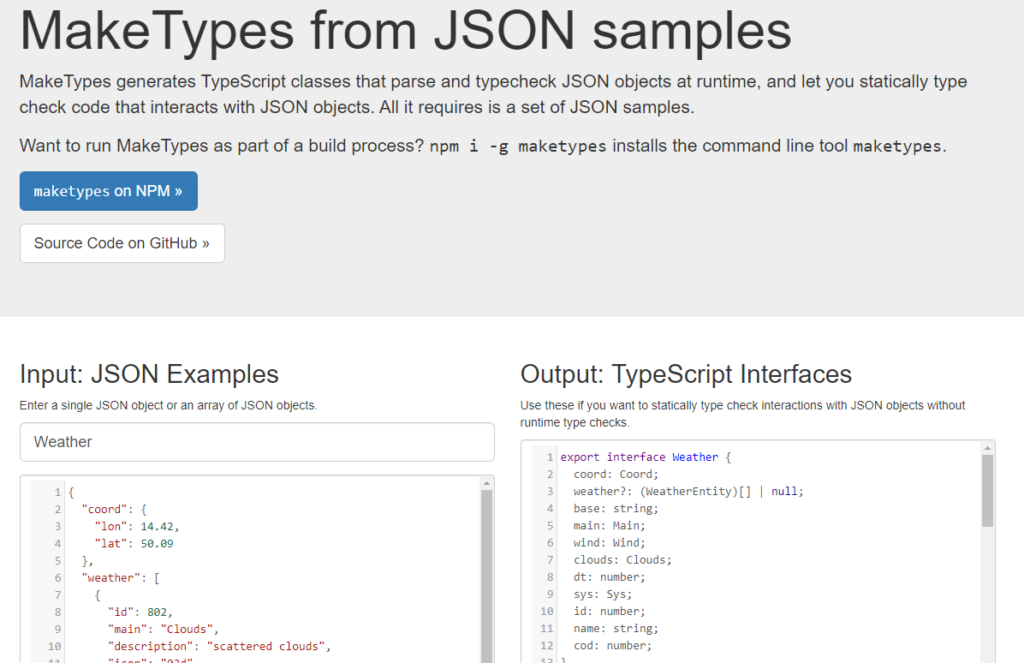
Recently, I heard about another option called MakeTypes. It’s as simple as the two previous tools, and it can also be downloaded via npm to be part of your local development process if that’s what you want:

Again, all you need to do is copy-paste your sample JSON and get instant Typescript interfaces (or proxy classes) to use in your project. And if you don’t want to use a website to create your types, head to the NPM page to download the tool.

How to update your Angular CLI?

We touched on many Angular 17 updates so far, and if you want to test those out on a fresh new project, you’ll need to upgrade your Angular CLI to v17.

Here is the most straightforward command to upgrade your global Angular CLI to the latest version:

npm install -g @angular/cli@latest

That’s it! The -g flag indicates we want to install that CLI globally, and the @latest at the end ensures we’re getting the latest stable version.

Angular 17: New devtools injector tree view

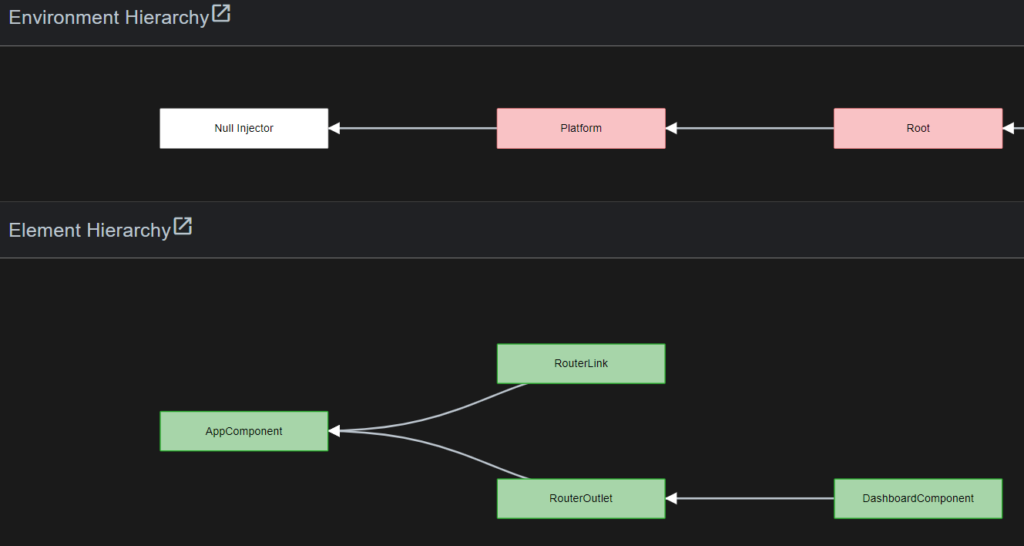
Another Angular 17 update is the release of a new DevTools panel called Injector Tree. It’s a good option to visualize both your element hierarchy and injector hierarchy, and it is accessible as a third tab in the Angular DevTools browser extension available for Chrome, Firefox, and Edge:

When we click on that tab, a tree view of all hierarchies shows up on the screen:

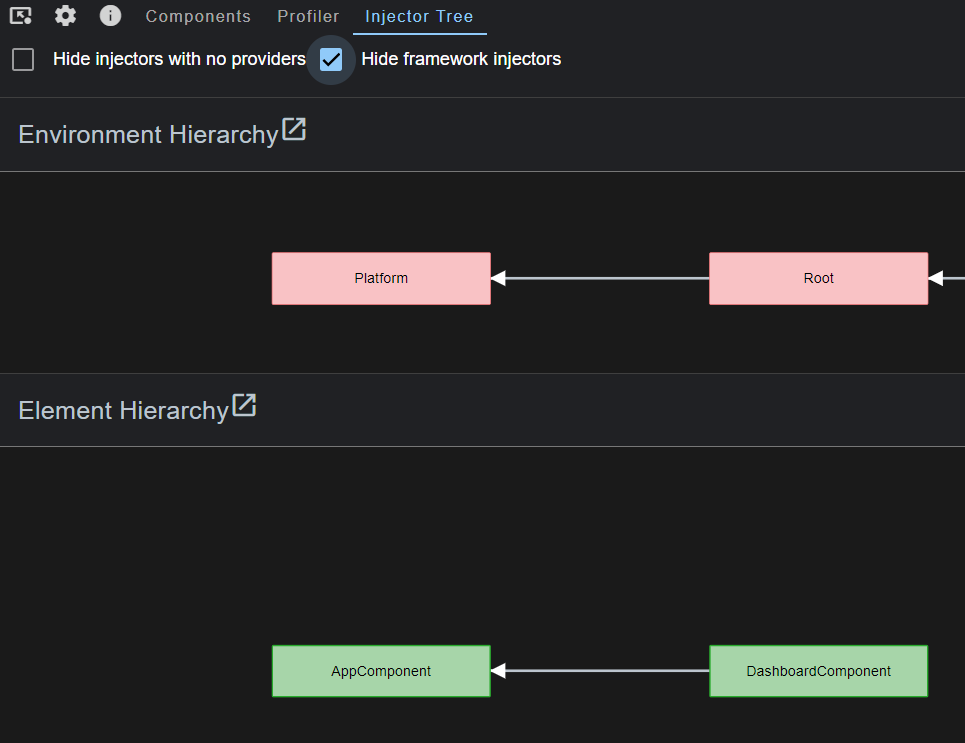
For a clearer view, we can check the option “hide framework injectors” to focus on our code:

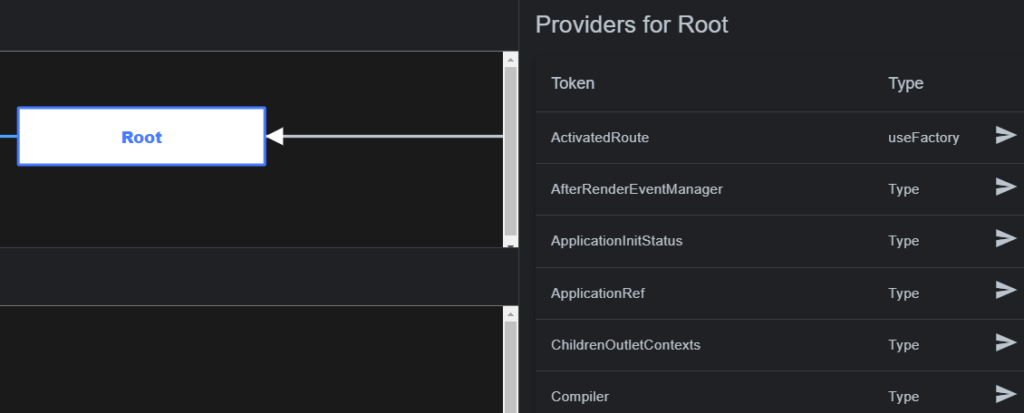
Clicking on an injector (such as root) shows the list of all injectables/services available in that injector:

This new tab seems to be just getting started, and more information will be added later. Even though the Devtools is a browser extension, the Injector tree tab only works for apps using Angular v17+. I tried an Angular v16 app with no success.

Angular 17: New esbuild builder with Vite

Who doesn’t like faster builds? Since Angular 2, the Angular team has consistently worked on making our builds quicker and faster. Angular 16 included a developer preview of a new build system based on esbuild and Vite.

With Angular 17, this feature is now enabled by default for new apps, with reported speed improvements of over 67% in most applications.

To enable this new build system in existing apps (that use v16+), open your angular.json file and look for all the places where @angular-devkit/build-angular:browser is used:

Then, replace those instances with @angular-devkit/build-angular:browser-esbuild

And your next run of ng serve or ng build will automatically use this new build system. Nice and easy! If you use server-side rendering or have tweaked the builders in the past, you’ll want to look at the extra instructions listed on this page.

RxJs eslint plugin for Angular

Last month, I discussed eslint and how to use that tool to parse your code and receive feedback on best practices and possible improvements.

Today, I want to mention an eslint plugin explicitly written for RxJs with Angular: eslint-plugin-rxjs-angular.

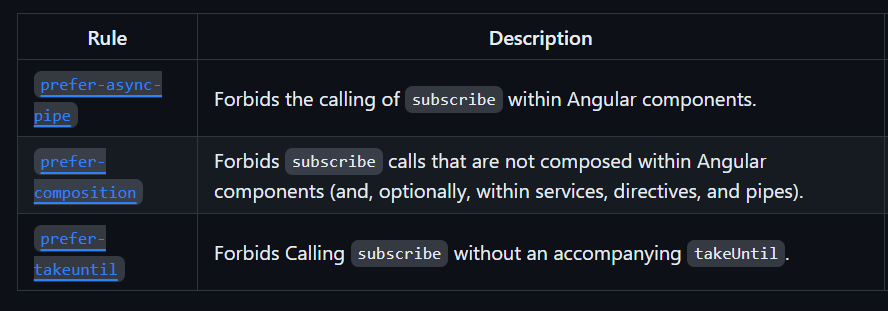
This plugin adds three possible validation rules:

All rules are optional, and it doesn’t make sense to use all of them at once because these best practices are contradictory in the sense that the goal is for you to choose one of these three approaches and be 100% consistent with it:

  1. The first rule will enforce that you always use the async pipe in your components.
  2. The second rule doesn’t care about the async pipe but wants to ensure you unsubscribe on destroy.
  3. The third rule is the most specific, as it enforces that you always use a Subject with takeUntil to unsubscribe in your components.

I’d suggest using the first rule only because we covered before that the async pipe is the safest and most performant option. And remember that you can always use the async pipe. There are no excuses!

Fine-tuning your eslint configuration

Last week, we introduced eslint and how it can help improve our code by identifying places where we have dead code or don’t follow best practices. Sometimes, we “break” some of these rules on purpose or decide to adopt a different convention, which is perfectly fine.

In that case, instead of giving up on eslint entirely, a better idea is to change its configuration to tweak the severity of a rule or even disable it. An es lint rule has three different severity settings:

  • “off” or 0 – turns the rule off
  • “warn” or 1 – turns the rule on as a warning (doesn’t make the lint command fail)
  • “error” or 2 – turns the rule into an error (makes the lint command fail with exit code 1 – a good option to fail a continuous integration build)

Such severity tweaks can be made in the .eslintrc.json file created in your project by the Angular schematics:

In the above example, I made the first two rules throw an error instead of a warning (I’m very much against disabling type-checking in TypeScript), but I’m OK with seeing some var keywords instead of let, so I turned off that third rule.

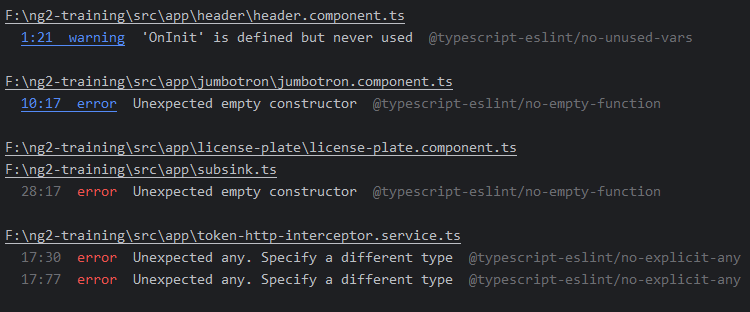
Getting the rule’s name is easy: When the linter fails, that name will be displayed in the console. Here @typescript-eslint/no-empty-function :

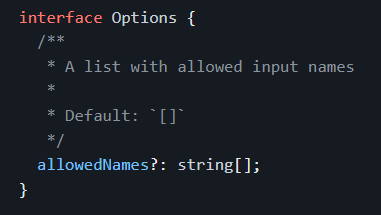
Some rules accept more configuration options to create an allowlist of accepted values. For instance, @angular-eslint/no-input-rename prevents you from renaming @Input values, but you can specify a config option that allows a few input names:

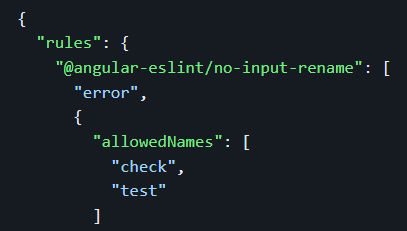
The config for that rule becomes an object that looks like this:

The above config allows renaming inputs only if the new name is check or test. This gives you more flexibility than turning off a rule entirely if it’s too restrictive for you.

Improve your code with eslint

eslint is a popular linter that parses your code and outputs a list of warnings and errors to help you improve. The library is designed to lint JavaScript code, and there are extra plugins for TypeScript and Angular so we can get even more specific feedback for our components and services. Here is an example of linting output:

A linter is a perfect complement to a compiler. For instance, angular-eslint, the eslint plugin for Angular, will also look at your HTML templates and flag code that doesn’t follow the Angular style guide. It’s also looking for possible mistakes, such as getting the ngModel 2-way data-binding syntax wrong:

To give you a better idea, here is the list of all the template rules and all the Angular TypeScript rules. If you want to give eslint a try, the first step is to install it with the help of some schematics:

This will download the proper dependencies and plugins and set up everything necessary to lint your code. If you’re using an older version of Angular or building a library instead of an app, there are step-by-step instructions to follow here. Once the set-up is done, all you have to do is run:

This command will parse all your files and output feedback in the console. Note that several IDEs can detect your eslint config and suggest automatic fixes to linting errors, which is even better!

Use Lighthouse to improve your Angular applications

As Angular developers, we tend to focus on component architecture, modules, TypeScript, and the best framework use. Most of the time, those things differ from what matters to end users.

End users usually want:

  • Performance – 60% of the web’s traffic happens on smartphones that don’t always have fast internet connections.
  • Accessibility – Is your website accessible to everyone? Did you check if color-blind people could see it correctly? Do you use alternate labels for images and buttons for screen readers that read the content to a blind user?

And, of course, if your website is supposed to be discoverable on the web, there’s search engine optimization (SEO).

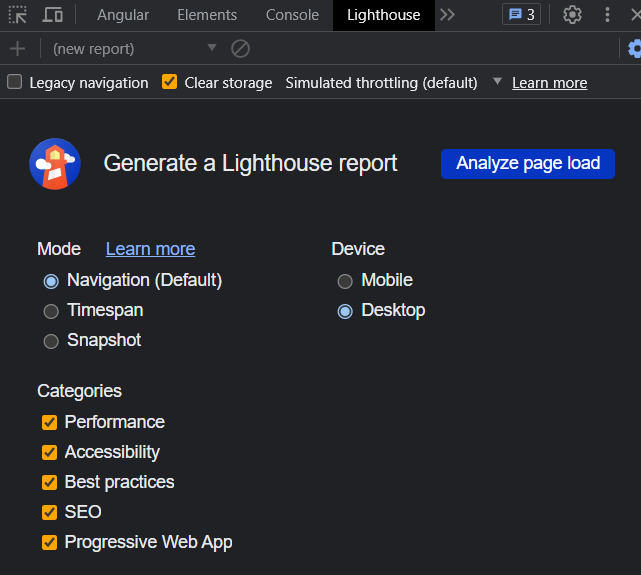
The best way to know how you’re doing in all these categories (and more) is to use a Google Chrome browser built-in feature called Lighthouse. It’s a tab available in the dev tools:

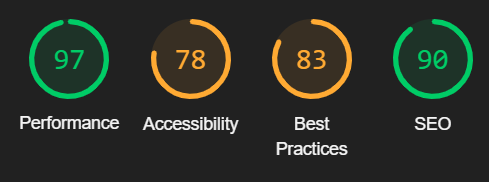
Navigate to your web app (a public URL is needed), open Lighthouse in the dev tools, and click the “Analyze page load” button. Note that you can also simulate a mobile device to get a different report. You’ll get a report with scores in all these categories:

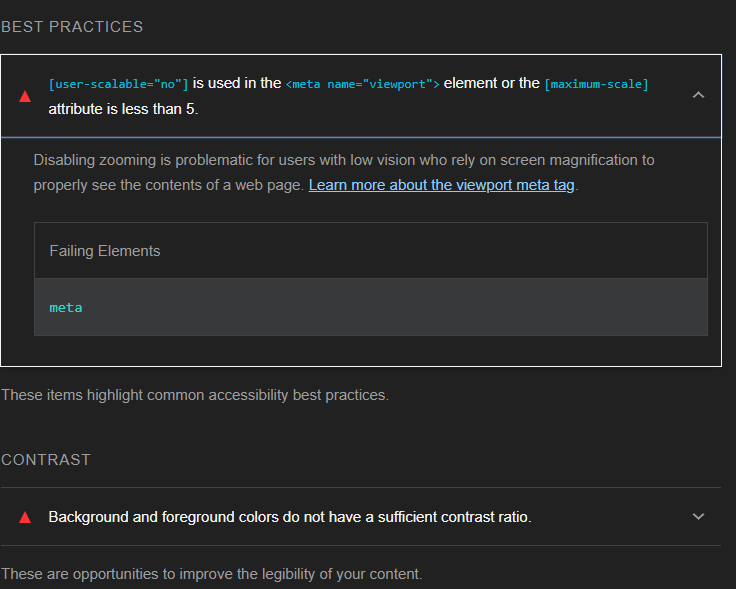
Clicking on any of the scores gives you a TODO list of possible improvements. You can expand every item to get more information about what to fix, how to do it, and why it’s important:

The nice thing about Lighthouse is that once you have improved your app, it takes just a few seconds to test your website again and see your scores increase.

Analyzing your bundle size

We covered build budgets and how they can help keep your application performant by detecting when a new dependency dramatically increases the size of your build output.

If you want to look at your build bundle and determine which dependency/module is the biggest, there’s another tool at your disposal: The Webpack Bundle Analyzer.

To install it, use the following npm command:

npm install --save-dev webpack-bundle-analyzer

Then, run your Angular build with the option that generates build statistics:

ng build --stats-json

Finally, run the Webpack Bundle Analyzer to read those build stats and give you a visual output of that bundle:

npx webpack-bundle-analyzer dist/stats.json

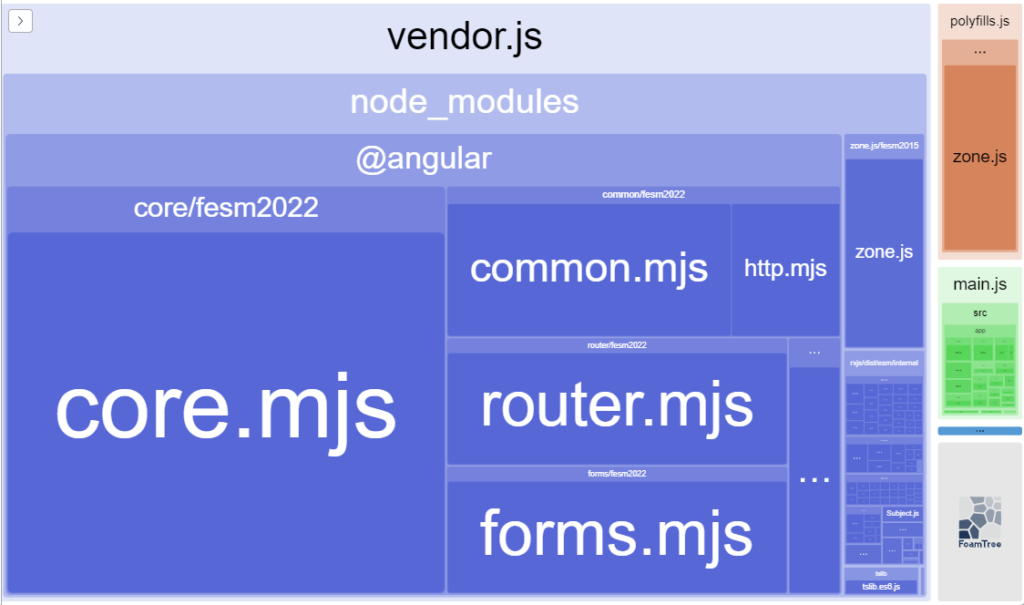
This command opens a new tab in your browser with the following user interface. Each rectangle represents a Javascript module. The bigger the rectangle, the bigger the module.

In the above example, we can see that the application code (main.js – in green color) is a lot smaller than the application dependencies.

For instance, we could improve this project by removing polyfills.js, as these polyfills were included to maintain compatibility with the now-retired Internet Explorer, and they take more space than our application code!