Last week, we introduced eslint and how it can help improve our code by identifying places where we have dead code or don’t follow best practices. Sometimes, we “break” some of these rules on purpose or decide to adopt a different convention, which is perfectly fine.
In that case, instead of giving up on eslint entirely, a better idea is to change its configuration to tweak the severity of a rule or even disable it. An es lint rule has three different severity settings:
- “off” or 0 – turns the rule off
- “warn” or 1 – turns the rule on as a warning (doesn’t make the lint command fail)
- “error” or 2 – turns the rule into an error (makes the lint command fail with exit code 1 – a good option to fail a continuous integration build)
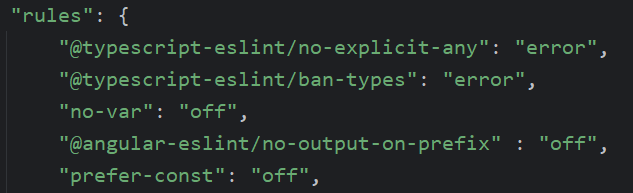
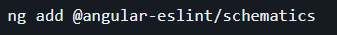
Such severity tweaks can be made in the .eslintrc.json file created in your project by the Angular schematics:
In the above example, I made the first two rules throw an error instead of a warning (I’m very much against disabling type-checking in TypeScript), but I’m OK with seeing some var keywords instead of let, so I turned off that third rule.
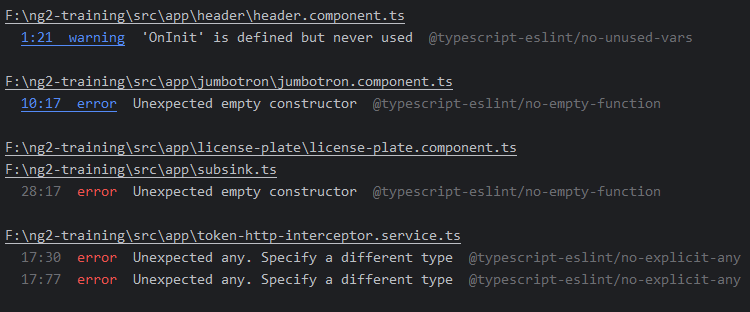
Getting the rule’s name is easy: When the linter fails, that name will be displayed in the console. Here @typescript-eslint/no-empty-function :
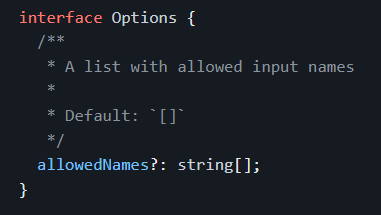
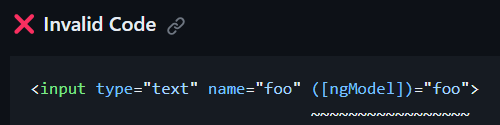
Some rules accept more configuration options to create an allowlist of accepted values. For instance, @angular-eslint/no-input-rename prevents you from renaming @Input values, but you can specify a config option that allows a few input names:
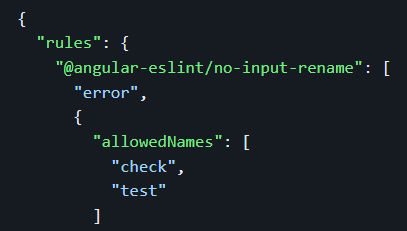
The config for that rule becomes an object that looks like this:
The above config allows renaming inputs only if the new name is check or test. This gives you more flexibility than turning off a rule entirely if it’s too restrictive for you.