Whenever we deploy a web application to production, one of the challenges is that our code will run on several different machines in different locations. When a user reports an error, we cannot access their browser console or stack trace unless the user is techy enough to share that information with us.
Of course, we can create a generic error handler and try to reproduce an issue in our environment, but this can be challenging as none of these options give us eyes on what is going on in that user’s specific browser.
This is where Rollbar shines. Rollbar is a library that can report Javascript errors to a server and create alerts/statistics/tracking of those errors over time:
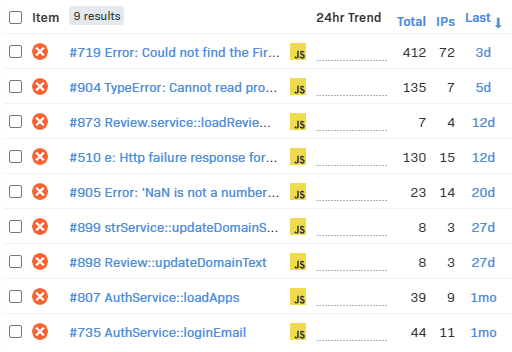
In the above screenshot alone, there is a wealth of information that we would never get with console.log. For instance, the first error has happened 412 times on 72 different machines (IPs), and the last occurrence was three days ago.
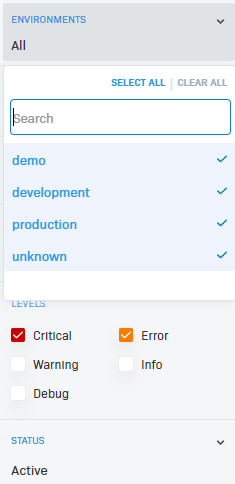
Such a screen can help you identify if a new release solved an issue for all users or created a new one. Even better, Rollbar supports different environments so you can check production or pre-prod, or staging environments for those errors, as well as filter by level, activity, etc. :
Each error contains the browser info, locale, screen definition, stack trace, and more. Errors can also be assigned to developers for further investigation and marked as fixed or muted if the error is irrelevant.
All in all, once people start using Rollbar, it’s almost impossible to stop using it. You can see an Angular demo on Stackblitz here and read this quick set-up tutorial from the Rollbar documentation.