Yesterday, we covered how to use the JSON pipe with a <pre> tag to debug JSON data on a web page.
Today, I want to cover one more debugging technique that is another time saver: The debugger keyword.
Whenever you want to add a breakpoint in your web application, add the Javascript instruction:
debugger;Code language: JavaScript (javascript)Then open the dev tools in your browser and navigate to your application URL. Whenever Javascript hits that debugger statement, the runtime will stop on that breakpoint, allowing you to debug your code:
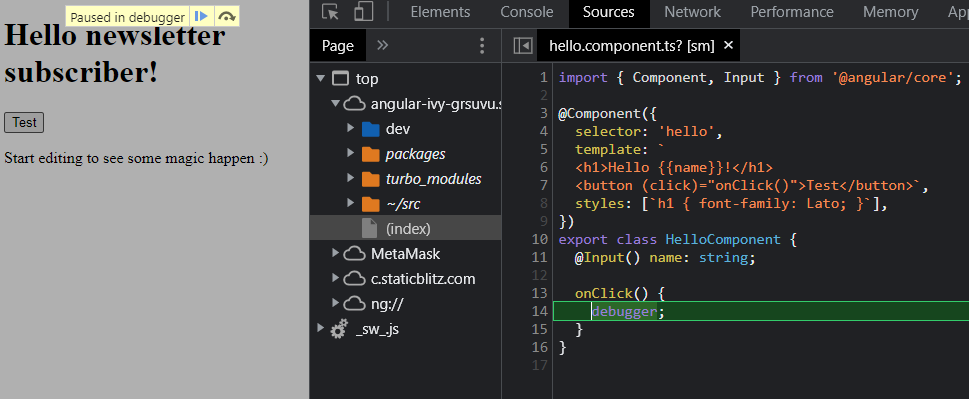
Once the browser is paused on that breakpoint, you can add other breakpoints by clicking on the line numbers in the browser dev tools, just like regular debuggers work.
Two important things to note:
- The breakpoint works only when the dev tools are open
- Don’t forget to remove the
debuggerstatement once you’re done debugging. You probably don’t want to ship that one to production.