The Angular dev tools introduced in our previous newsletter include a second tab called Profiler:
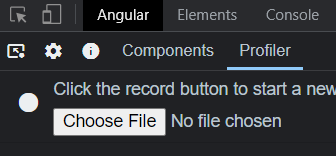
The Profiler has a single record button. We can hit it, play with our application, then stop the recording. This turns the UI into a profiler view of what happened during the recording. In the example below, we can see how a click generated a change detection event that impacted several components:
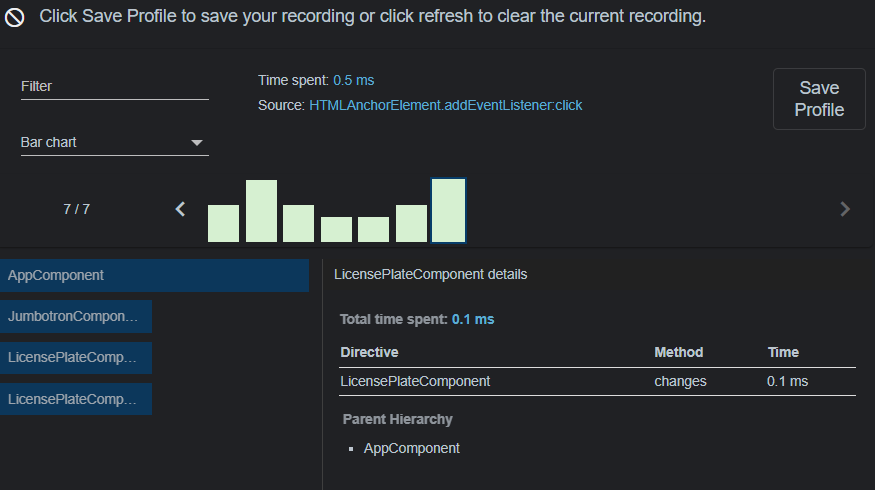
As you can see in the above screenshot, every change detection event is tracked as a bar chart entry. The taller a bar is, the more time it takes to complete that cycle. We can explore which components and directives are impacted for each event and how long it took to re-render that component (in the above example, 0.1 ms).
When facing a performance issue, the Profiler is perfect for identifying the problem’s root cause. For instance, it could highlight that one component is much slower than the others and gets refreshed for no good reason, indicating that a different change detection strategy is needed.
The official documentation showcases all individual features of the Profiler one by one.