Angular 9 introduced the ng namespace variable, which is available in development mode but not exposed when the application is running in production mode.
We can debug an application using that global namespace without any breakpoint or dev tools extension. Here’s how.
First, select a DOM element
Using your browser dev tools, select a DOM element on the page as follows:
When an element is selected using the above process, it becomes assigned to a variable called $0 in the developer tools console. The previous selection is known as $1, the one before that $2, and on and on.
Then, use the ng workspace functions
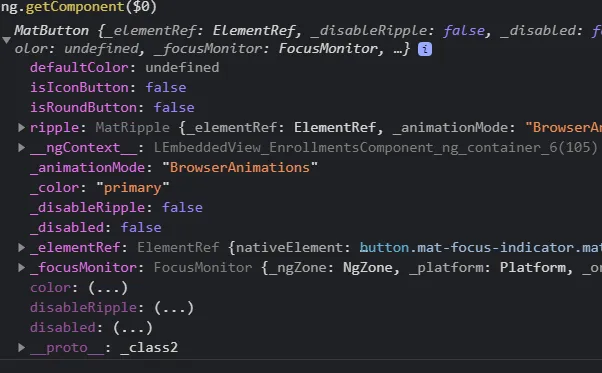
If the selected DOM element is an Angular component, you can head to the browser console and type ng.getComponent($0). This returns a reference to the component instance – ready to be explored and debugged:
If the element you select is not a component (say a div or an image), use ng.getOwningComponent($0) to get a reference to the parent component of the selected DOM element.
If you want to select the directives applied to that element, use ng.getDirectives($0). It’s also possible to access the context of a template in a ngFor or ngIf directive.
There are a few more useful functions available in that global namespace.