Lifecycle of Angular applications

The lifecycle of an Angular application is something that many aspiring Angular developers struggle with. People often ask me questions such as:

  • How long does this component/service/directive stay in memory?
  • How do I save the data before I navigate to the next page/view/component?
  • What happens if I open that same app in another browser tab?

Here is how to think about it:

  • When we open an app in a browser tab, we’re booting an Angular application in a self-contained memory space, similar to a virtual machine.
  • Closing that tab is equivalent to killing the application, freeing any memory associated with it, just like when you close a desktop app in your machine’s operating system.

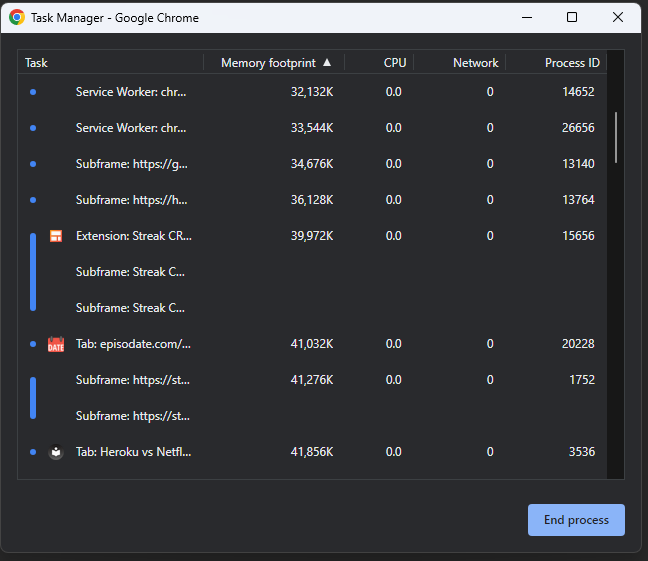
In Google Chrome, there’s even a task manager where you can see the memory footprint and CPU usage of your tabs and browser extensions – they’re just like independent desktop apps:

From an Angular perspective, a component gets loaded in memory whenever displayed on the screen. That’s when its class is instantiated.

Suppose the component gets removed from the screen (by navigating to a different component or removing it with a ngIf directive, for instance). In that case, the component is destroyed, and all of its memory state is gone. The same goes for directives and pipes: They get created when used by a component template and destroyed when that component gets destroyed.

Services are different, though. A service is created by Angular when a component needs it for the first time. Then, that instance remains unique and shared between all components that inject such service. A service doesn’t get destroyed: It remains in memory as long as your app is open and you don’t close your browser or tab.

This answers our three initial questions:

  • How long does this component/service/directive stay in memory?
    Components stay as long as they’re in the DOM. Services stay as long as the app is open.
  • How do I save the data before I navigate to the next page/view/component?
    Not if you save it in a service
  • What happens if I open that same app in another browser tab?
    You create another separate instance of everything: Components, services, etc. Both instances are independent and do not share any data or memory space.

Build size budgets

As mentioned earlier in this newsletter, the size of your Javascript matters a lot, as our code has to be downloaded first, then parsed and interpreted by a browser, which will get slower and slower as the size of your app increases. This is why we want optimized production builds. And this is also why it’s always a good idea to keep track of the size of your production code after each build.

Fortunately, the Angular team has our back and integrated build budgets in the Angular CLI. You can use those budget settings to decide when to get a warning or even fail a build it your code becomes too big. This configuration happens in angular.json:

The above (default) budgets would warn you if your Javascript exceeds 500Kb in size and fail once the build exceeds 1Mb. Those are already part of your projects, so you don’t have to do anything to use them.

If you do continuous integration, your build will fail right after the commit that degraded your bundle size, making it easy to troubleshoot and fix the issue.

Most of the time, dependencies are the culprits. I remember coaching a client who needed some Excel-like features in the browser, and their build exploded to over 25MB because of a massive monolithic Javascript Excel library. Thanks to the build error, we knew that this library wouldn’t work, so we chose a lighter one instead.

In the past, I’ve also inherited projects where I would track our build size version after version. My client was amazed to see that despite adding features, the build was getting smaller and smaller after each release, thanks to Angular always being better at tree-shaking and having the incentive to clean up old code and make it smaller. When you start tracking a metric, you want to improve it!

Running unit tests on continuous integration servers

We talked about unit testing a couple of times last week. One of the main benefits of unit tests is that they run quickly and provide immediate feedback. As a result, we get the best return on investment when running those unit tests on a continuous integration (CI) server after each commit.

Two challenges come with running unit tests on a CI server:

  1. The default test runner for Angular projects (Karma) opens a Chrome browser to run the tests, which is challenging on most CI servers (typically Unix based with no UI support).
  2. The ng test command doesn’t stop on its own. It keeps watching the source code for updates and then reruns the tests.

Fortunately for us, there is a single command that addresses both problems:

Running the command will result in a single test run (thanks to --watch false) and will run in a UI-less way (thanks to --browsers ChromeHeadless). That’s all your CI server needs to do.

If you’re using an older version of Angular, this old tutorial of mine might help you configure Karma accordingly.

Rollbar: Error tracking and reporting

Whenever we deploy a web application to production, one of the challenges is that our code will run on several different machines in different locations. When a user reports an error, we cannot access their browser console or stack trace unless the user is techy enough to share that information with us.

Of course, we can create a generic error handler and try to reproduce an issue in our environment, but this can be challenging as none of these options give us eyes on what is going on in that user’s specific browser.

This is where Rollbar shines. Rollbar is a library that can report Javascript errors to a server and create alerts/statistics/tracking of those errors over time:

In the above screenshot alone, there is a wealth of information that we would never get with console.log. For instance, the first error has happened 412 times on 72 different machines (IPs), and the last occurrence was three days ago.

Such a screen can help you identify if a new release solved an issue for all users or created a new one. Even better, Rollbar supports different environments so you can check production or pre-prod, or staging environments for those errors, as well as filter by level, activity, etc. :

Each error contains the browser info, locale, screen definition, stack trace, and more. Errors can also be assigned to developers for further investigation and marked as fixed or muted if the error is irrelevant.

All in all, once people start using Rollbar, it’s almost impossible to stop using it. You can see an Angular demo on Stackblitz here and read this quick set-up tutorial from the Rollbar documentation.

Updates from ng-conf 2023

I’m writing this message up in the air over the desertic landscapes of Nevada as I’m flying back to California from ng-conf 2023. It has been two days filled with lots of information, and I will unpack some of the major announcements in more detail in the following newsletters.

For now, I’ll focus on some rapid-fire news grouped by topic:

RxJs

  • RxJs 8 is coming out soon, and it will be 30% smaller than RxJs 7 and 60% smaller than RxJs 6!
  • Will have support for async / await syntax for Observables.
  • We will have some new syntactic sugar for chaining operators using a rx() function. Code such as obs$.pipe(map(...), filter(...)) will be writable as rx(obs$, map(...), filter(...)). Optional, yet good to know.

NgRx

  • Support for a Signal Store is coming soon

Endbridge

Other cool news

  • Bard, Google’s response to ChatGPT, is built with Angular!
  • Analog.js is a meta-framework for Angular apps. It supports server-side rendering, static pages, back-end APIs, and regular Angular front-end code all in one project, all in Javascript. Similar to Next.js for React. Analog is still a work in progress but looks promising.

Using a loading template with ngrxLet

A while back, I wrote about how ngrxLet is an improved version of the async pipe. I also covered how to use skeleton loaders with Angular.

Today, let’s look at how we can use these two tools to display a “loading” template while an observable is waiting for data.

As a reminder, here is how ngrxLet can be used to track different observable events:

In the above code snippet, we receive the values emitted by the number$ observable in a variable n. We would receive any error in a variable e. We would receive the completion status (true or false) in a variable c.

Here is how we can pass a custom loading template to ngrxLet using a template reference variable:

Of course, the loading template can be customized with anything you want, including a skeleton loader or an animated gif image. That feature is called a suspense template, and an observable is in a suspense state until it emits its first event (next, error, or complete as covered here).

Anti-pattern: Not using production builds to deploy production code

This is one of the most common mistakes I see with my training/consulting clients. When deploying code to production, they would use the command: ng build.

Instead, you want to use: ng build --configuration=production

Why is that? Because a production build is optimized in several ways:

  1. The code gets minified and obfuscated, which means it looks like this when running in a browser:

This code is as lightweight as possible (no tabs, whitespace, new line characters, variables have super short names, etc.) and a lot more challenging to understand (a hacker would have a harder time understanding your code).

2. The code gets tree-shaked. Angular removes unused dependencies and dead code and makes your build output as tiny as possible. Size matters on the web: The less code you ship to a browser, the faster it gets downloaded, parsed, and interpreted (which is also why Angular gives us lazy-loading capabilities)

3. Source maps are not generated in that same spirit of hiding what our source code looks like.

4. Angular DevTools are disabled on that code, again for obfuscation and reverse-engineering purposes.

If you’re still not convinced after reading all of this, give it a try on your Angular projects. The size of your dist folder after a production build should be at least 90 to 95% smaller compared to a regular build, which is massive.

Skeleton loaders with Angular

Skeleton loaders are grey-shaded shapes that indicate when a part of the screen is loading. Here is an example of skeleton loaders for Facebook:

ngx-skeleton-loader is a small component library that does just that. It gives us access to different skeleton loaders ready to be used in our applications:

What’s nice about that library is that we can customize different aspects of the skeletons, such as animations and colors. You can find some live examples here.

If you want to explore skeleton loaders for your application, feel free to look at my popular tutorial: How to use a skeleton loader with Angular?

The tutorial has several code examples that can be used as-is.

Angular Documentation Tricks

If you use Angular, you’re most likely familiar with the Angular website: https://angular.io.

But did you know that you access the documentation of a previous framework version by using the version number as a prefix, such as https://v14.angular.io?

Even better, you can get a glimpse of the future with https://next.angular.io or take a look at the current Release Candidate version: https://rc.angular.io.

Also, the header of the website has a different color whenever you’re not on the current version:

The red header is for the next version of Angular, the grey is for a past version, orange is for an RC, and blue is for the current one.

Sometimes though, the documentation does not answer all the questions we have, in which case we are just one click away from accessing the source code of any feature:

I used those tricks over and over again to prepare my course on Angular Signals. That’s how I could get a glimpse of the future and prepare several newsletter issues before the release of Angular 16.

Angular DevTools Extension

Angular DevTools is a browser extension that provides debugging and profiling capabilities for Angular applications (v12 minimum). It’s available for Chrome, Firefox, and Edge.

The extension comes with a tree view of the component hierarchy of our application. You can expand and collapse components to inspect their properties, inputs, and outputs. Hovering a component in the tree view highlights it in the user interface, as shown here:

We can explore inputs and outputs and even change those values to test how the UI would respond to different values:

There’s also a search feature where you can type the name of a component to find it in a complex component hierarchy:

Those features alone can be a huge time saver—no need for debugger breakpoints or JSON pipe to inspect our data. The inspector always displays up-to-date component information.